carlmfischer.com weather
I purchased a La Crosse weather station (WS2812) and installed the Heavy Weather software on my CCTV server, since this is the only Windows machine I have running 24x7. The weather station feeds data to the software, and stores current weather data in the currdat.lst file. I periodically copy the file to my Linux server and parse through the currdat.lst file to get various readings from the station.
I am a big fan of graphing the output of various readings, and use MRTG for capturing Server Temps and other data points. I thought I could use MRTG for this but found MRTG only uses integers, and I needed to capture values that were not always integers.
I searched around for an alternative and ended up using RRDTool to capture the data, and graphing out via RRDTool Graph. I am by no means an expert at RRDTool, but these steps gave me the information I need to get values graphing fairly quickly.
Obtain Outdoor Temperature
The weather data file (currlst.dat) has the various weather readings. In this case, I want the outside temperature:
[outdoor_temperature]
I then have a script to look at the file, and just get me the outside temperature in Farenheit and store that in a file:
deg_C="7.2"
deg_F="45.0"
#!/bin/bash
The grep -A 2 looks for the outdoor_tempearture, then reads the next two lines
grep -A 2 'outdoor_temperature' currdat.lst >outdoor_temp.dat
cat outdoor_temp.dat | egrep "deg_F" | awk 'match($0,"="){print substr($0,RSTART+2,4)}' >outdoor_temp_data.dat
Then the next line in the script looks for "deg_F" and then starts reading 4 characters after the first quotes '"'. I need to find a better way of reading this, if it ever gets to 100+ degrees, or below zero, this will not work.
Next, I'm on the to creating the RRD database for outdoor temperature.
RRDTool to create the RRD
This is script I use to create the RRD for the outside temperature:
#!/bin/sh
There are much better tutorials to explain what each of the variable do, but this created a database I could use, so I went with it. Now, I need to feed it values...the next step.
rrdtool create outdoor_temp.rrd \
--start N \
-s 300 \
DS:temp:GAUGE:600:U:U \
RRA:AVERAGE:0:1:5000
Update RRD with values
This is script I use to update the RRD for the outside temperature. It uses the outdoor_temp.dat file that is used when I obtain the outdoor temperature:
#!/bin/sh
Now that the database is receiving values, I need to then update the graph...the next step.
var=`cat outdoor_temp.dat`
for i in $var; do
/usr/bin/rrdtool update outdoor_temp.rrd N:$i
done
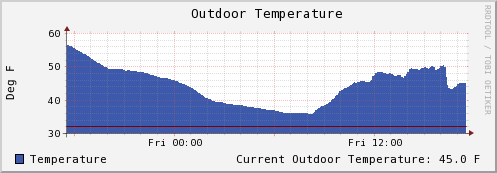
Graph the values using RRDTool Graph
This is script I use to graph the values for the outside temperature::
#!/bin/sh
I use the HRULE:32#80000 to draw a line at 32 degrees, just for kicks. The AREA: fills the graph, as opposed to a single line. I initially had just the single line (LINE1:) but found I like the graph showing the area better.
rrdtool graph /www/outdoor_temp.png -a PNG --title="Outdoor Temperature" --vertical-label "Deg F" \
DEF:temp=outdoor_temp.rrd:temp:AVERAGE \
LINE1:temp#3D59AB \
AREA:temp#3D59AB:Temperature \
HRULE:32#800000 \
'GPRINT:temp:LAST:Current Outdoor Temperature\: %2.1lf F'
Now I have the outdoor temperature graphing.
Graph the values using RRDTool Graph for Week, Month, Year
I then can use another script to graph the values for longer than 24 hours:
#!/bin/sh
Now I have the outdoor temperature graphing.
rrdtool graph /www/outdoor_temp_year.png -a PNG --title="Outdoor Temperature Year" --vertical-label "Deg F" \
--height 150 \
--start "-1year" \
DEF:temp=outdoor_temp.rrd:temp:AVERAGE \
LINE1:temp#3D59AB \
AREA:temp#3D59AB:Temperature \
HRULE:32#800000 \
'GPRINT:temp:LAST:Current Outdoor Temperature\: %2.1lf F'
You can change the --start "-1year" to "-1week" and/or "-1month" to get weekly and monthly graphs as well.
RRDTool Cron
The final step involves setting up cron to let the scripts run every minute to grab the data and graph the output.